Results
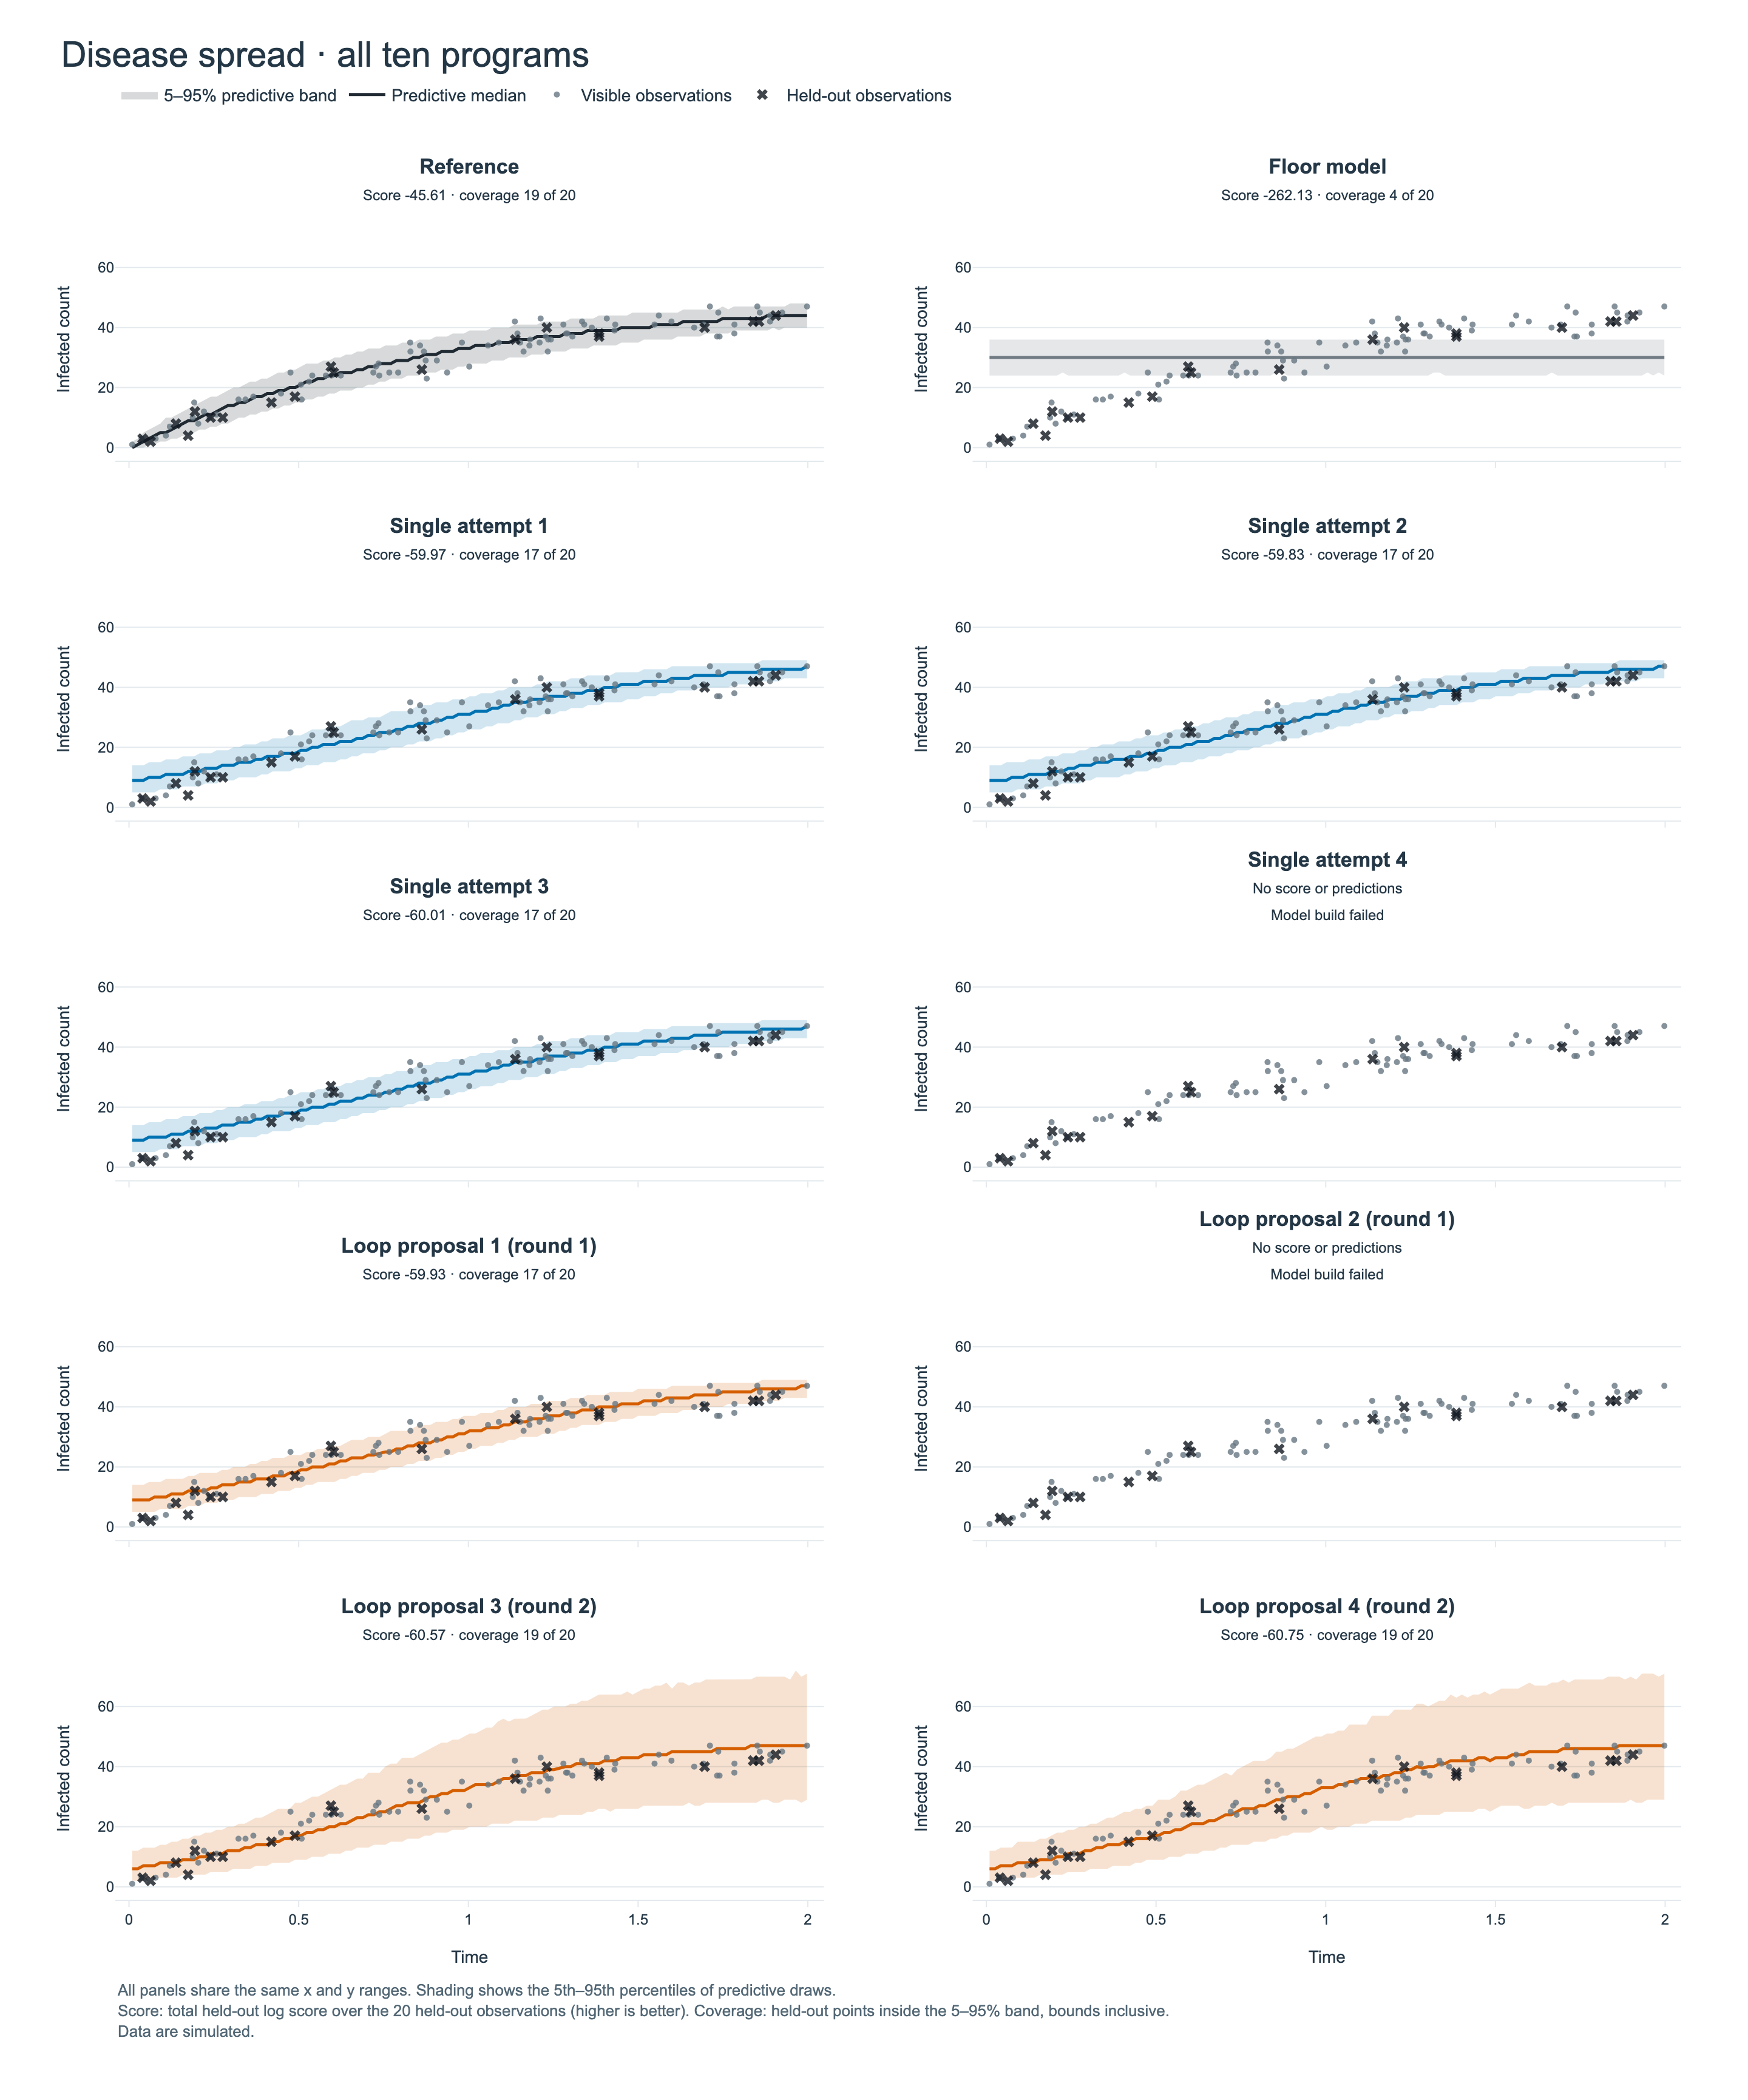
Disease spread (infected count against time, population 50)
Scores and coverage
Higher log scores are better within this task. Coverage counts the held-out observations inside the 90 percent predictive interval (5th to 95th percentile, bounds inclusive); the nominal count is 18 of 20.
Eight of ten programs scored; one single attempt and one loop proposal failed at model build. Failed programs keep their panel, with the observations and no predictive band.
| Program | Held-out log score | Coverage (of 20) |
|---|---|---|
| Reference | -45.6085 | 19 |
| Floor model | -262.1291 | 4 |
| Single attempt 1 | -59.9733 | 17 |
| Single attempt 2 | -59.8279 | 17 |
| Single attempt 3 | -60.0128 | 17 |
| Single attempt 4 | failed at model build | |
| Loop proposal 1 (round 1) | -59.9324 | 17 |
| Loop proposal 2 (round 1) | failed at model build | |
| Loop proposal 3 (round 2) | -60.5719 | 19 |
| Loop proposal 4 (round 2) | -60.7518 | 19 |
Posterior predictions