SynthStats
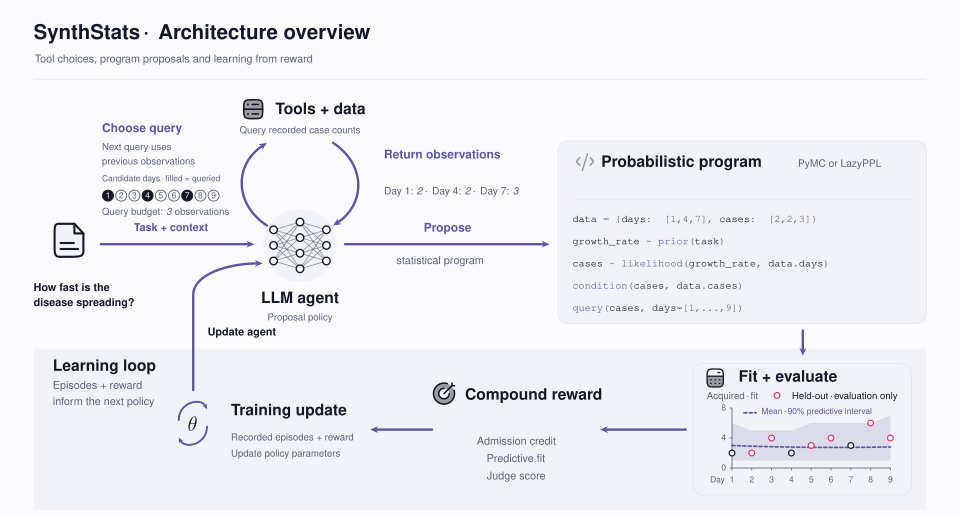
SynthStats trains language-model agents to write probabilistic programs. A probabilistic program states a statistical model in code (in Python with PyMC, or in Haskell with LazyPPL), and we ask for one with AI safety in mind: a person can read the assumptions it makes and check its predictions before relying on them.
Before it submits a program, an agent can request observations and run its own code, choosing its queries under a budget. What it submits is then checked against our modelling rules, fitted to the observations, and scored on observations held out from fitting. Read the ARIA Brief or the training comparisons in the ARIA Milestone report.
Two demonstrations
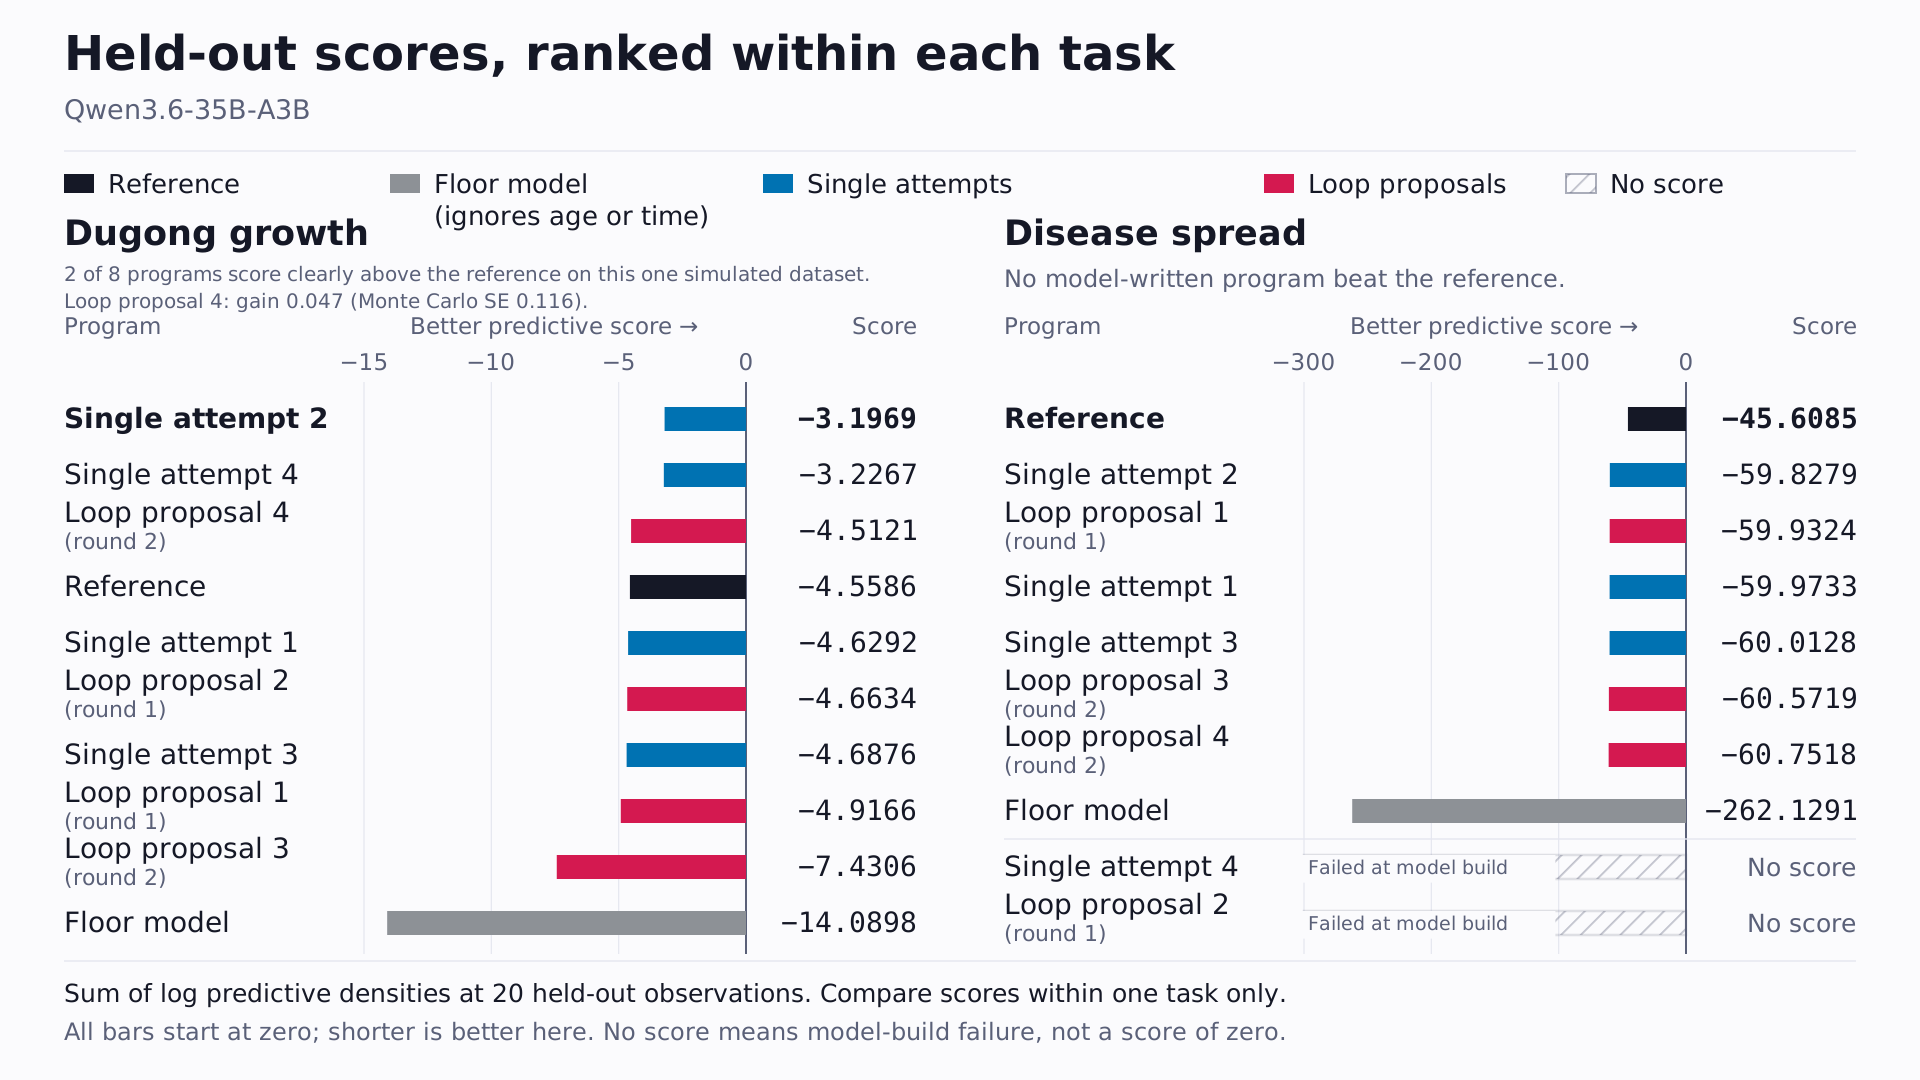
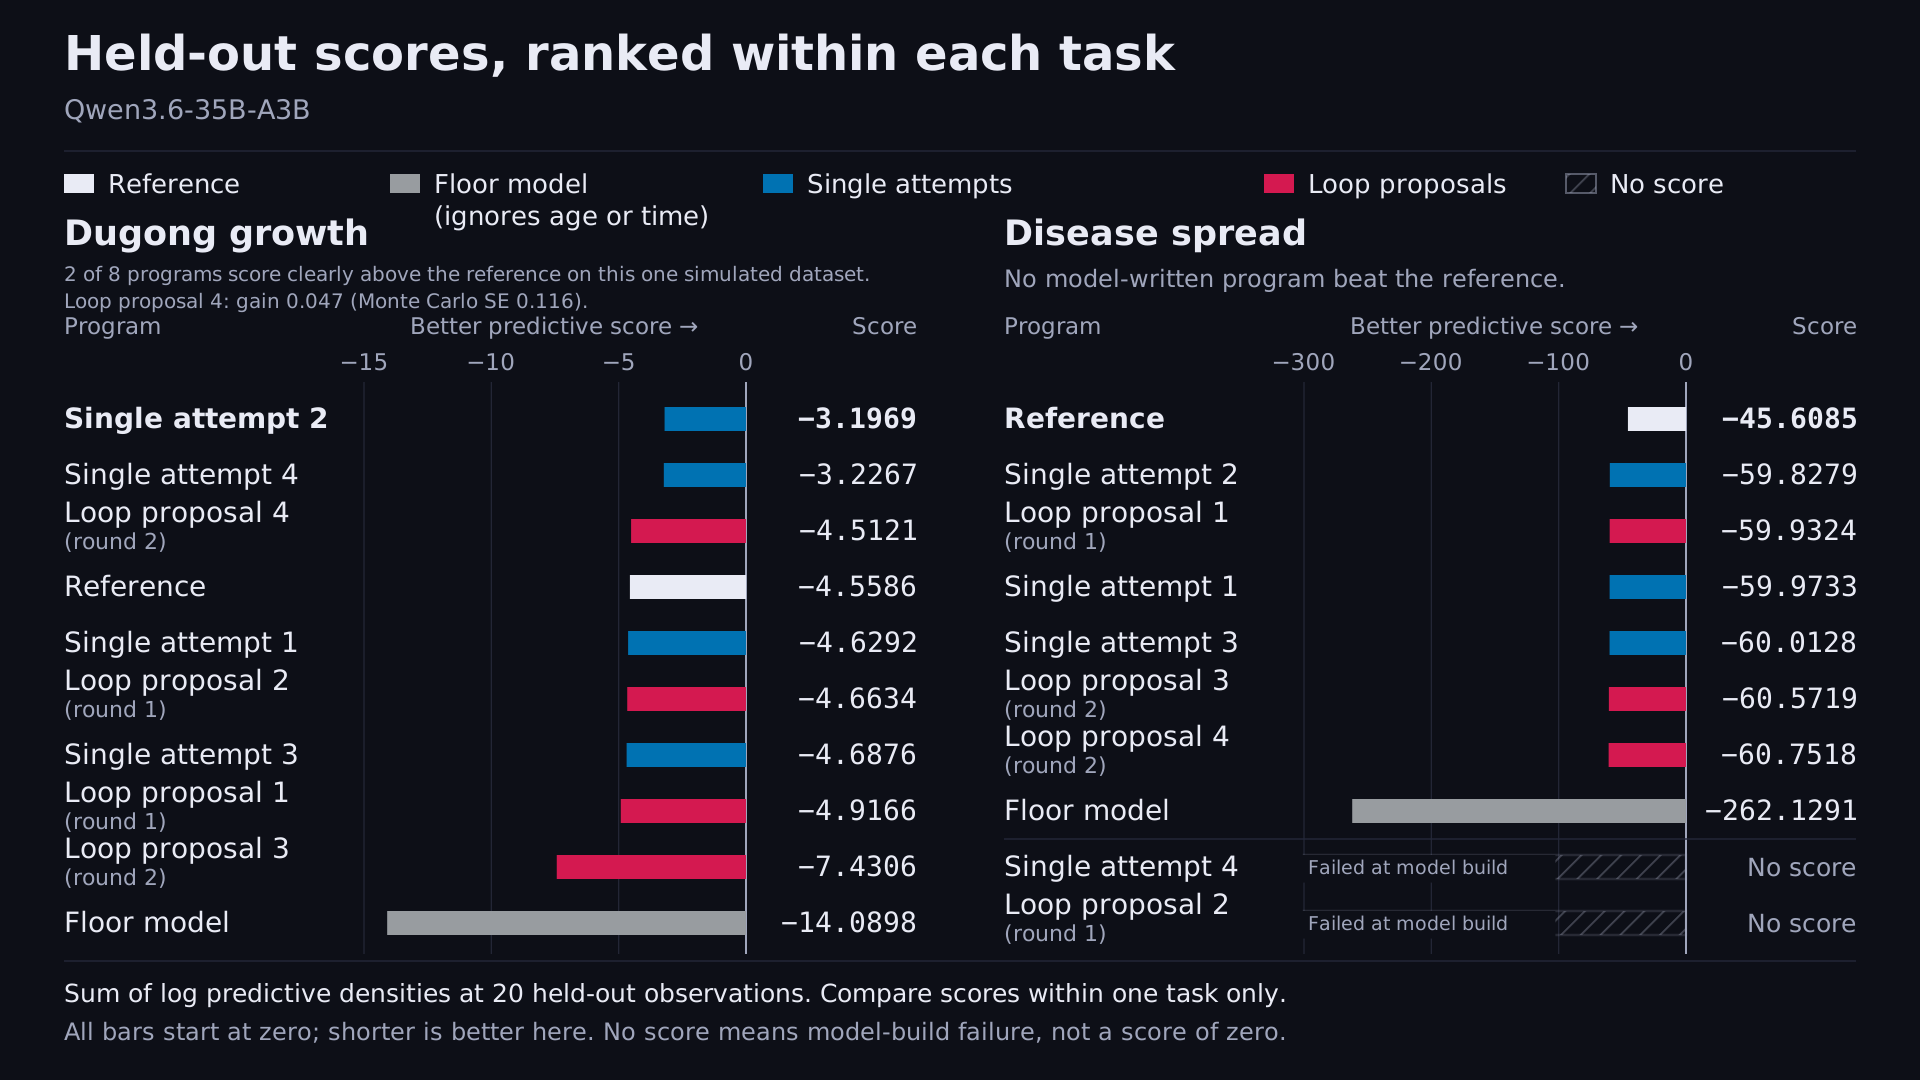
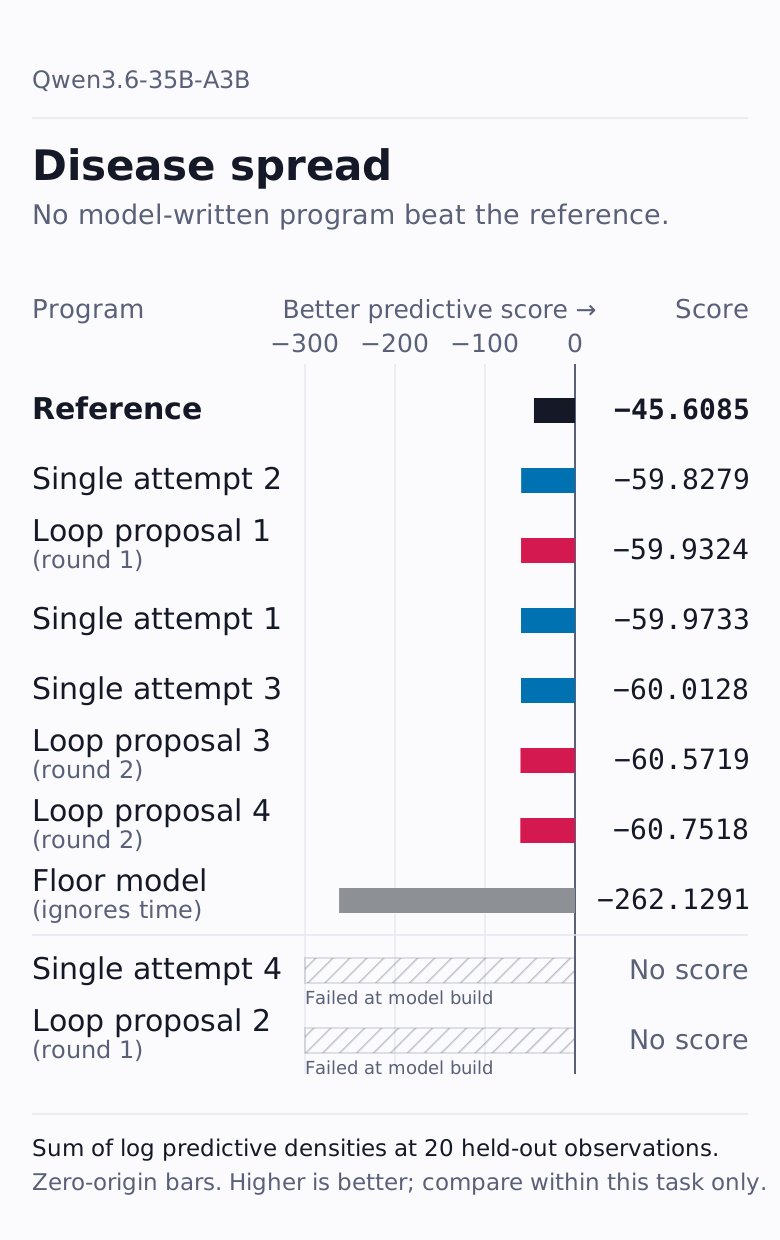
Dugong growth is one of two environments we took from BoxingGym, a benchmark of simulated scientific environments. The other is disease spread: a program predicts how many of 50 individuals are infected at a given time. The prompted model Qwen3.6-35B-A3B wrote eight disease-spread programs; six received a score, and all six scored above the floor model and below the reference.
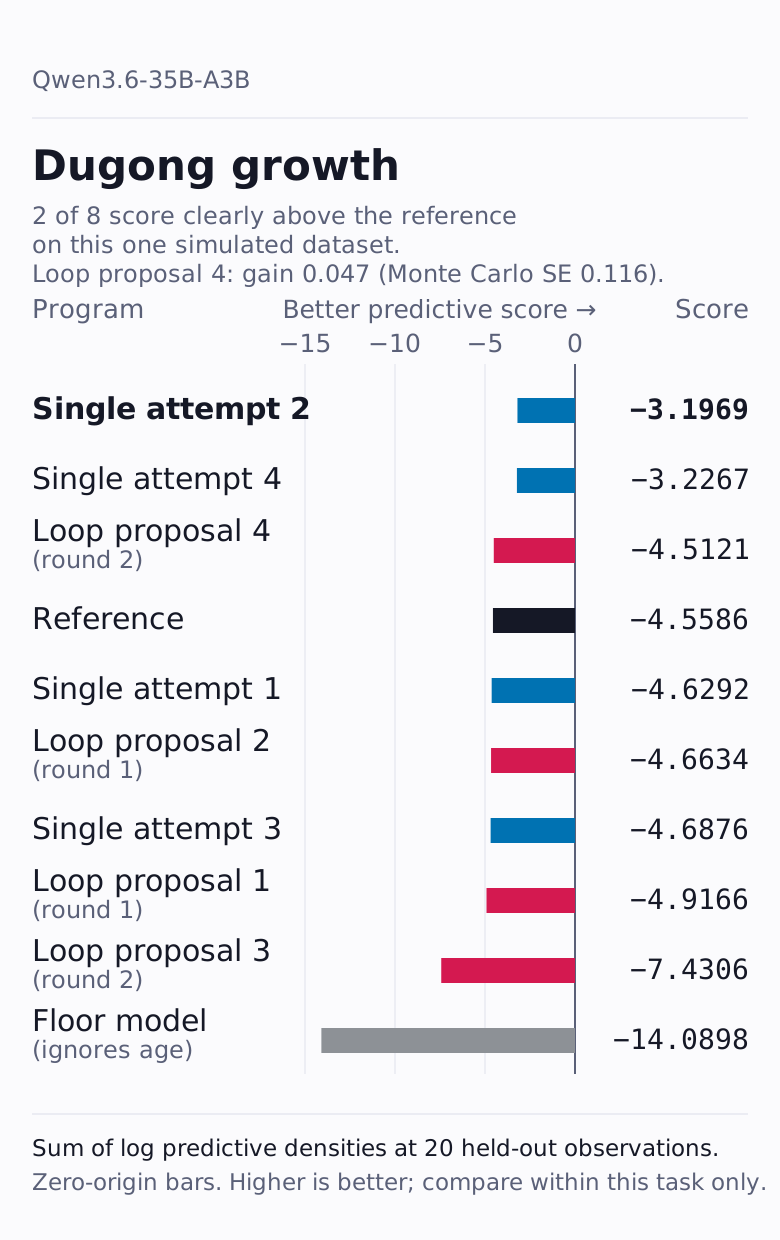
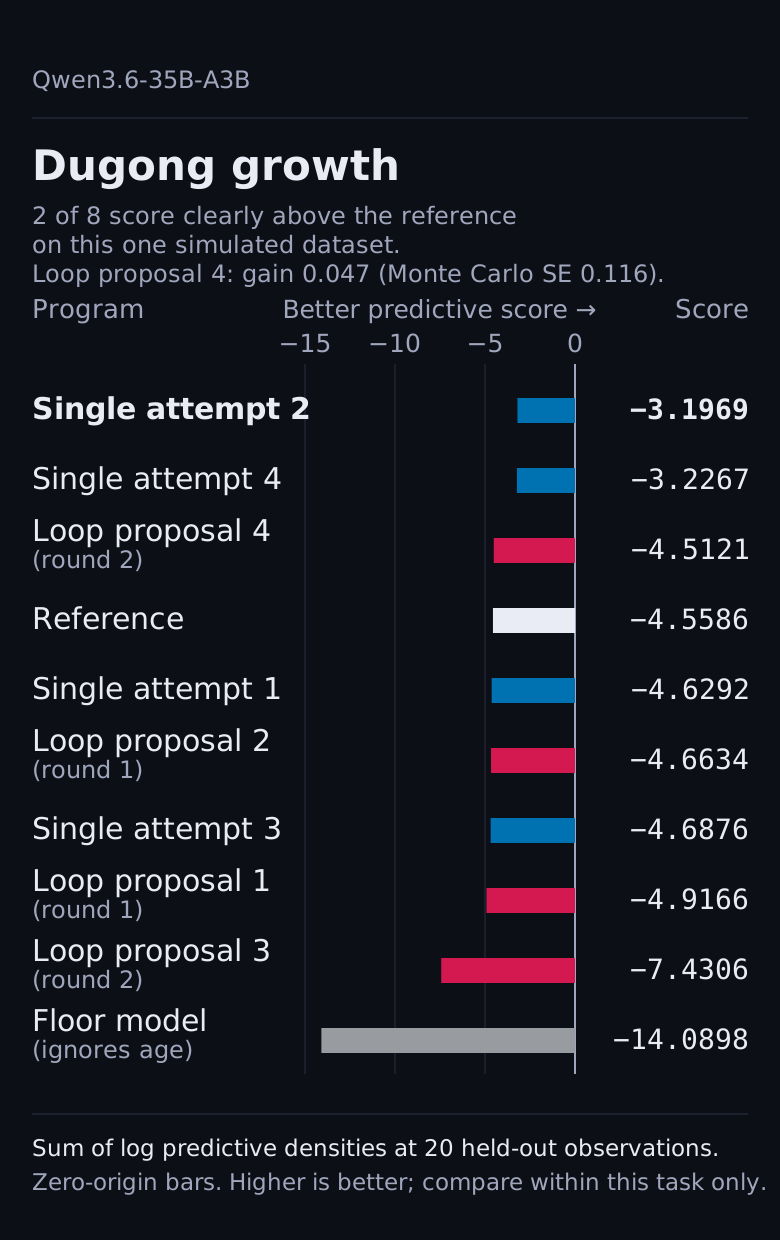
The Monte Carlo standard error (MCSE) measures the error from estimating a score with 200 posterior draws of the fitted model. The 200 draws form ten consecutive batches of 20. Each draw has an influence on the total held-out log score: how much it raises or lowers that total compared with an average draw. We average these influences within each batch. The MCSE is the standard deviation of the ten batch means divided by the square root of ten. A difference between two programs has a combined MCSE: the square root of the sum of the squares of the two MCSEs. The sum treats the two fits as independent. For dugong single attempt 2, which scores 1.3617 above the reference, the MCSE is 0.0190 for the attempt and 0.0761 for the reference, so the combined MCSE is sqrt(0.0190^2 + 0.0761^2) = 0.0784.
Scores below are shown as estimate ± MCSE.
| Predictive score on observations held out from fitting (held-out log score); one simulated dataset per task, higher is better within a task | Dugong growth | Disease spread |
|---|---|---|
| Reference program, written with knowledge of the simulator | -4.5586 ± 0.0761 | -45.6085 ± 0.0452 |
| Floor model, one predictive distribution for every input | -14.0898 ± 0.1042 | -262.1291 ± 0.5574 |
| Four single attempts, one call each with no feedback | -4.6876 ± 0.0539 to -3.1969 ± 0.0190 | -60.0128 ± 0.2010 to -59.8279 ± 0.2392 (three scored) |
| Four loop proposals: two programs, the language model's critique of them, then two more | -7.4306 ± 0.1294 to -4.5121 ± 0.0879 | -60.7518 ± 0.1383 to -59.9324 ± 0.1301 (three scored) |
The page on how one program is scored works through our dugong reference program one held-out observation at a time, until the twenty values add up to its score of -4.5586.
All twenty programs