
Report
Two demonstrations, each on one BoxingGym environment: each takes a task in English and observed data, and returns scored PyMC programs and their predictions. Ten candidate PyMC programs come from four sources: the reference, a program we wrote ourselves knowing how the environment generates its data, which is the comparison point for the others; the floor model, which ignores the input and uses one predictive distribution for every input value; four single attempts by the Qwen3.6-35B-A3B language model, with no feedback; and four loop proposals from a two-round loop that writes two programs, has a critic comment on them, and writes two more. All ten are checked before fitting; each one that passes is fitted, scored on the held-out rows, and used to predict them.
On the dugong task every one of the eight model-written programs beat the floor model, which scored -14.0898; the eight ran from -7.4306 to -3.1969, and three of them beat the reference at -4.6028. On disease spread the six scored model-written programs ran from -60.7518 to -59.8279, all above the floor model at -262.1291; the reference scored -45.6085.
Natural-language task + visible data
  -> the reference, the floor model, four single attempts, four loop proposals
  -> structural checks
  -> posterior fit and held-out log score
  -> predictions from retained posterior draws
Each comparison has those ten programs. The loop proposes two programs in a first round, a critic comments on them, and those comments go into the prompts for the second round.
The held-out log score is the total log predictive density over the 20 held-out responses; higher is better, and scores compare only within one task. Coverage is the fraction of those 20 observations inside the 90 percent predictive interval (5th to 95th percentile, bounds inclusive), against a nominal 0.9.
Prediction sampling repeats each retained posterior draw 20 times, giving 4,000 draws of a future observation per input.
Scoring and prediction ran on PyMC 5.21.1, PyTensor 2.28.3 and ArviZ 0.23.4.
Dugong growth
80 visible observations and 20 held out; all ten programs produced predictions.
The dugong data is one simulated episode from the environment's own generator.
Natural-language task
Write a PyMC probabilistic model of dugong length as a function of age. Your model must be a Python
function `def model(data):` that returns a `pm.Model` instance, reading its data from the `data`
dictionary and declaring an observed likelihood for `length`.

Lengths of dugongs (sea cows) recorded at known ages. 80 observations are provided.
The first program in the table below is the reference, the one we wrote: a growth curve with three parameters and a fixed noise scale, with the environment's own priors.
import numpy as np
import pymc as pm

def model(data):
    """Dugong length against age: the growth curve and priors of BoxingGym's
    dugongs environment, with a Normal likelihood and a fixed noise scale.
    """
    age = np.asarray(data["age"], dtype=float)
    y = np.asarray(data["length"], dtype=float)
    with pm.Model() as dugongs_model:
        age_data = pm.Data("age_data", age)
        alpha = pm.Normal("alpha", mu=2.0, sigma=0.2)
        beta = pm.Normal("beta", mu=1.5, sigma=0.5)
        lam = pm.Normal("lam", mu=0.4, sigma=0.5)
        mu = alpha - beta * pm.math.abs(lam) ** age_data
        pm.Normal("length", mu=mu, sigma=0.25, observed=y)
    return dugongs_model
Every program was checked before fitting: parse, syntax-tree inspection, model build, a restricted PyMC subset, and a data-sensitivity check. A program that passed was fitted and scored on the held-out observations; a program that failed has no score.
Held-out log scores and interval coverage for the ten programs on one dugong episode.
| No. | Program | Held-out score | Coverage of the 90% interval (5th to 95th percentile) | Outcome |
|---|---|---|---|---|
| 1 | Reference | -4.6028 | 15/20 (75%) | scored |
| 2 | Floor model | -14.0898 | 16/20 (80%) | scored |
| 3 | Single attempt 1 | -4.6292 | 16/20 (80%) | scored |
| 4 | Single attempt 2 | -3.1969 | 18/20 (90%) | scored |
| 5 | Single attempt 3 | -4.6876 | 16/20 (80%) | scored |
| 6 | Single attempt 4 | -3.2267 | 18/20 (90%) | scored |
| 7 | Loop proposal 1 (round 1) | -4.9166 | 16/20 (80%) | scored |
| 8 | Loop proposal 2 (round 1) | -4.6634 | 16/20 (80%) | scored |
| 9 | Loop proposal 3 (round 2) | -7.4306 | 16/20 (80%) | scored |
| 10 | Loop proposal 4 (round 2) | -4.5121 | 17/20 (85%) | scored |
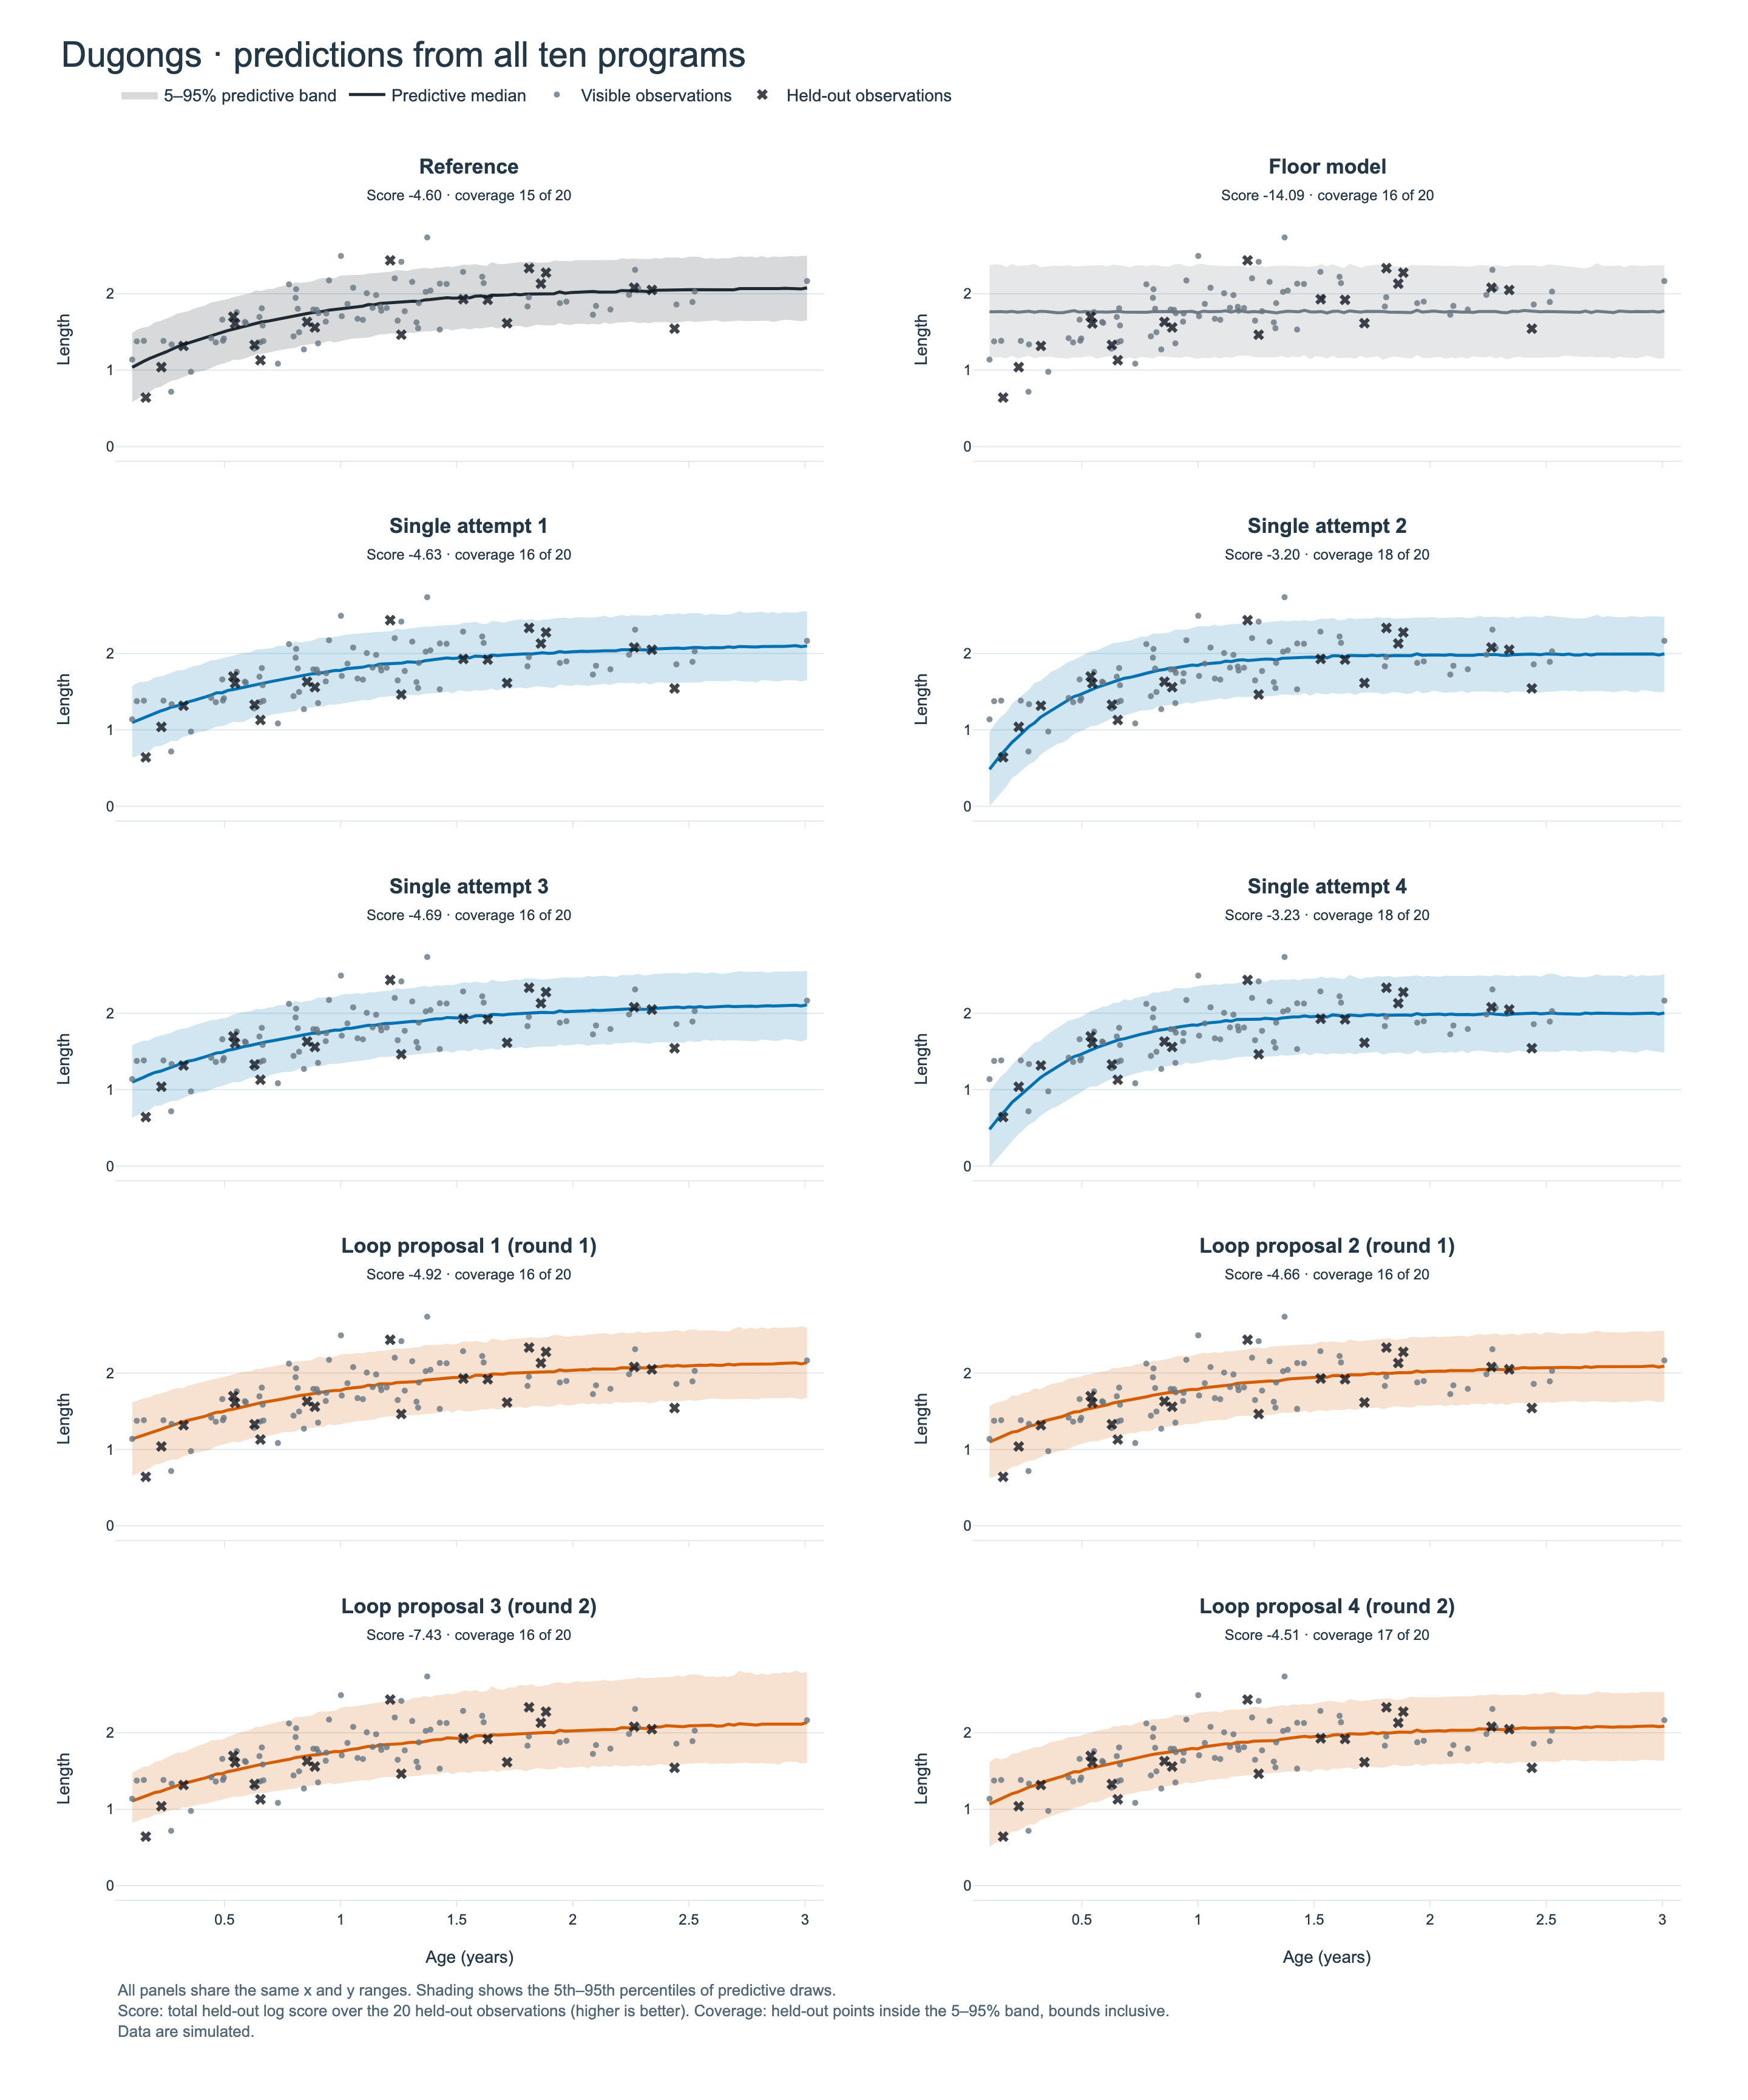
Grey points show visible observations, black crosses show held-out observations, and the line and band show the predictive median and the 5th to 95th percentiles. All panels share both axes. The data are simulated.
Generation and fitting costs
Model calls, tokens, ceilings and times for each arm.
| Arm / activity | Model calls | Input tokens | Output tokens | Output ceiling | Request wall seconds | Scoring seconds | Sampler seconds |
|---|---|---|---|---|---|---|---|
| Reference | not applicable | not applicable | not applicable | not applicable | not applicable | 15.90 | 5.00 |
| Floor model | not applicable | not applicable | not applicable | not applicable | not applicable | 11.65 | 1.00 |
| Single attempts | 4 | 13,612 | 6,484 | 8,192 per arm; 2,048 per call | 29.99 | 75.51 | 29.00 |
| Loop proposals | 4 | 25,724 | 5,215 | 8,192 per arm; 2,048 per call | 25.33 | 116.02 | 67.00 |
| Loop critics | 2 | 20,834 | 1,519 | 4,096 total; 2,048 per call | 7.81 | not applicable | not applicable |
Each program that passed the checks was fitted the same way: 200 tuning iterations and 200 retained draws in one chain. Scoring seconds include validation and runtime overhead. The loop also runs one fit per proposal, at the same 200 tuning iterations, 200 draws and one chain.
The loop's own fits of its four proposals sampled for 50.95 seconds in total; the loop's run took 87.87 seconds in all.
Disease spread
80 visible observations and 20 held out; eight of the ten programs produced predictions and two failed.
Natural-language task
Your goal is to be able to reliably predict the number of infected individuals at specific times. Conduct experiments to learn about the environment and make predictions based on your observations.

Write a PyMC function `def model(data):` returning a `pm.Model`. Read the supplied data dictionary and declare an observed likelihood for `Infected_Count`. The final scorer performs fitting; do not sample at module scope.

Synthetic disease-spread observations in a population of 50 individuals; Time lies strictly between 0 and 2.

80 observations are provided.
Held-out log scores and interval coverage for the ten programs on one disease-spread episode.
| No. | Program | Held-out score | Coverage of the 90% interval (5th to 95th percentile) | Outcome |
|---|---|---|---|---|
| 1 | Reference | -45.6085 | 19/20 (95%) | scored |
| 2 | Floor model | -262.1291 | 4/20 (20%) | scored |
| 3 | Single attempt 1 | -59.9733 | 17/20 (85%) | scored |
| 4 | Single attempt 2 | -59.8279 | 17/20 (85%) | scored |
| 5 | Single attempt 3 | -60.0128 | 17/20 (85%) | scored |
| 6 | Single attempt 4 | no score | no predictions | failed at model build |
| 7 | Loop proposal 1 (round 1) | -59.9324 | 17/20 (85%) | scored |
| 8 | Loop proposal 2 (round 1) | no score | no predictions | failed at model build |
| 9 | Loop proposal 3 (round 2) | -60.5719 | 19/20 (95%) | scored |
| 10 | Loop proposal 4 (round 2) | -60.7518 | 19/20 (95%) | scored |
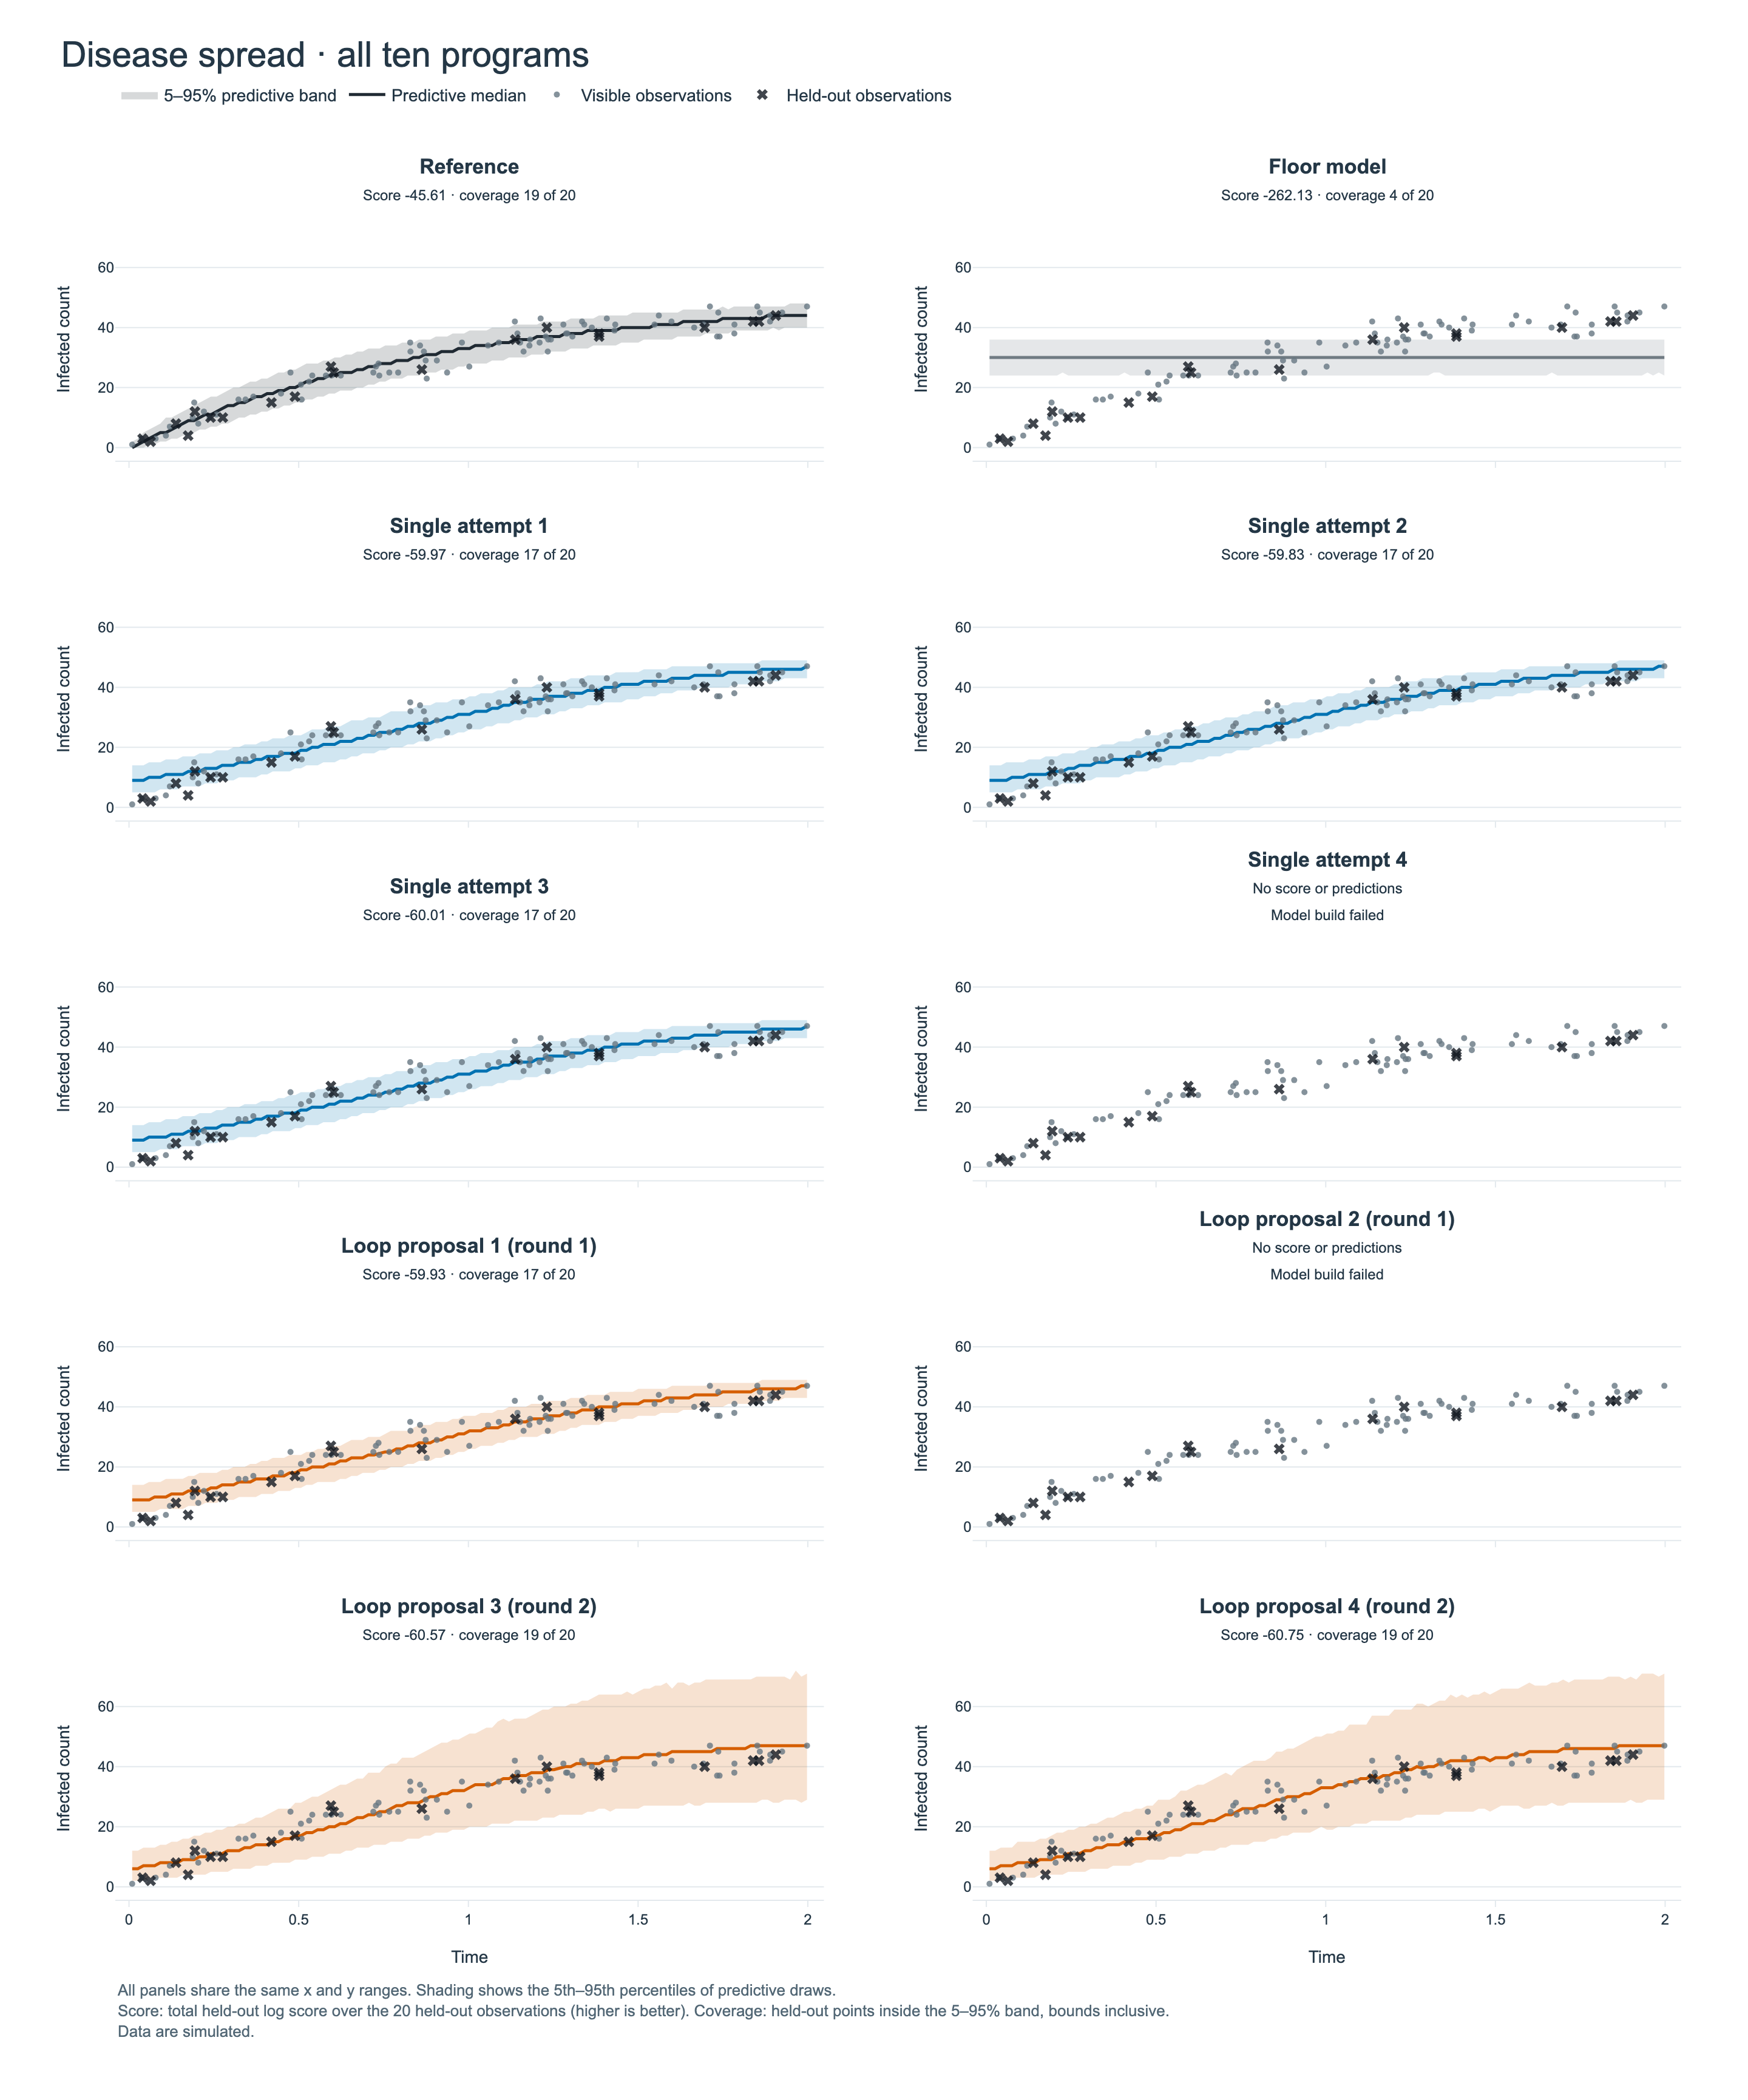
Grey points show visible observations, black crosses show held-out observations, and the line and band show the predictive median and the 5th to 95th percentiles. All panels share both axes. A panel for a failed program keeps its observations and its outcome, with no predictive band. The data are simulated.
Generation and fitting costs
Model calls, tokens, ceilings and times for each arm.
| Arm / activity | Model calls | Input tokens | Output tokens | Output ceiling | Request wall seconds | Scoring seconds | Sampler seconds |
|---|---|---|---|---|---|---|---|
| Reference | not applicable | not applicable | not applicable | not applicable | not applicable | 16.79 | 3.00 |
| Floor model | not applicable | not applicable | not applicable | not applicable | not applicable | 13.29 | 1.00 |
| Single attempts | 4 | 8,672 | 4,976 | 8,192 per arm; 2,048 per call | 24.18 | 58.96 | 10.00 |
| Loop proposals | 4 | 19,554 | 4,760 | 8,192 per arm; 2,048 per call | 24.52 | 64.28 | 13.00 |
| Loop critics | 2 | 15,982 | 1,324 | 4,096 total; 2,048 per call | 7.56 | not applicable | not applicable |
Each program that passed the checks was fitted the same way: 200 tuning iterations and 200 retained draws in one chain. Scoring seconds include validation and runtime overhead. The loop also runs one fit per proposal, at the same 200 tuning iterations, 200 draws and one chain.
The loop's run took 45.80 seconds.
This page is also available as one self-contained HTML file: download the report.